One vendor number to stop accepting and 7 questions to ask: Read this before making a digital twin, synthetic data, or simulation decision
One number to stop accepting
Lots of platforms quote a single headline accuracy figure: 91%. 95%. "Within three points." But if you ask what that number is a percentage of, the conversation sometimes has a way of mysteriously ending.
A mean can be close while the shape of the answers is wrong, and the shape is where business decisions are made. One fix is a statistic almost nobody quotes: Jensen-Shannon divergence. It compares the entire distribution of synthetic answers to the entire distribution of human answers on the same question, option by option. Zero means identical shapes. By our rule of thumb, under about 0.05 means the shapes are close. (And we often get a lot closer than that!) It is cheap to compute and brutal on outputs that collapse to the middle, which is why you rarely see it in a sales deck.
Seven questions to ask
1. What is underneath? Which human respondents, from which studies, on which population, how recent? Which forms of data (survey, transcript, behavioral, transaction, and so on)? Ingested in raw form or only in summary deck form? If the answer is "the model plus a persona description," you are buying the internet's opinion of your customer. The Columbia mega-study found a persona given only demographics scored the same on accuracy as a twin built from 500 of the person's own answers. [1] Descriptions and tethered digital twins built from individual respondents -mostly disappointing: Columbia's correlated with their humans at about 0.20. [1] (Individual humans are just too complex to model; modeling emergent interactions between groups of synthetic individuals is even harder!) In our parallel tests, respondent data clustered–in real-time–into clusters holds up much better. [4] There’s a reason organizations typically seek to understand people at the segment level in order to engage them and persuade them to act or think differently.
2. Is the validation automated, or was it conducted manually once? Validate against each dataset you generate with a platform. Standardized validation means every synthetic study passes through the same tests before release and the client sees the results. Consistent improvement becomes possible.
3. Do you test the distribution, or only the mean? Jensen-Shannon (or similar) divergence per question, or an equivalent. Then the spread: is the synthetic standard deviation as wide as the human one? Then the tails: do minority answers survive, or does everything regress to the modal consumer? If so, your outputs will be category average and hardly unique to your brand or business challenges.
4. Does the structure hold? Real respondents' answers hang together. Someone who says price is the barrier does not (usually!) also say they never look at price. Ask for a correlation-structure test across question pairs (we use Cramér's V) and a "top-two box" match rate on ranked items: does the synthetic sample pick the same winning concept, claim or package the humans did? This decides whether the data can be productively cross-tabbed, which is necessary to shape strategy, innovation, or messaging for particular customer segments.
5. What is the denominator? Humans disagree with themselves. In Columbia's own panel, people re-asked the same questions matched their earlier answers 81.72% of the time. [5] A synthetic accuracy figure without the human test-retest figure beside it has no ceiling and no meaning. Ask for both, and ask how two human samples differ on your own tracker before you judge a synthetic gap of five points.
6. Did it predict, or remember? If the model saw the answers it is being graded against, the grade is worthless. Ask for the exact-match check and the privacy test on the same run. A vendor who cannot tell you the exact-match score cannot tell you whether the output was predicted or recalled.
7. Can you show me the misses, show me where the humans come in, and show any improvement over time? Every validated study has questions it got wrong. Ours get labeled: "lead" where the synthetic data can carry a decision, "support" where it belongs beside other evidence, "explore" where it is for ideation only. Then ask how the human study launches, whether it uses the same questionnaire on the same platform, and whether the human result feeds the next synthetic run. Finally ask about other ways synthetic data outputs can improve over time: with additional client data ingestion, with improved weighting, with improved targeting, and so on.
Some more evidence in case you want to dive in:
Columbia Business School's study of digital twins found the twins' answers had less spread than the humans' on 154 of 164 outcomes while often landing near the right average. [1] Pew Research Center's test of AI survey-takers found the model turning attitudes held by a plurality into near-unanimity: 97% of Hispanic adults following the World Cup, against an actual 43%. [2] A preprint this month found that personas built from descriptions of people recovered only 53 to 67% of the real variation between them. [3] None of those failures show up in a mean. [4] The number matters less than the process. If a vendor cannot show you a distribution comparison, they haven't looked.
One way Panoplai handles automated validation:
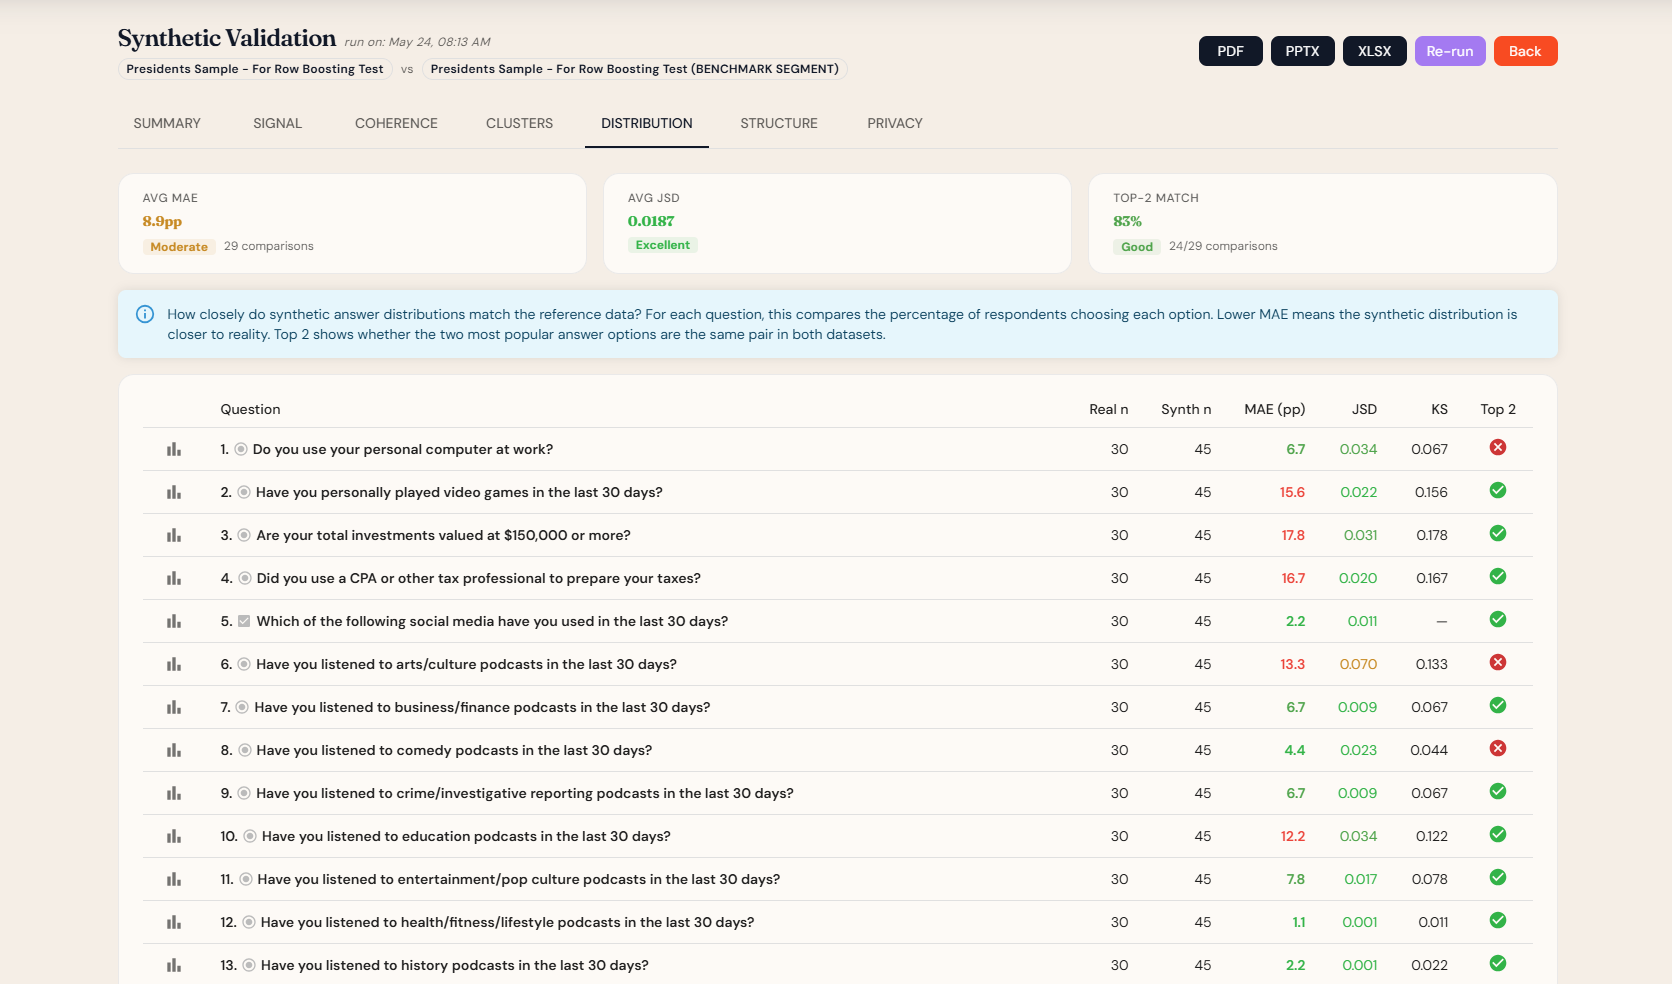
We show clients automated comparisons per question in real-time, available within a simple to use dashboard, each coded green (use with confidence), yellow (directional only), or red. If the answer is yellow or red, a human study with AI probing can be launched at the touch of a button to gather more foundational data. Or we can always ingest more client or syndicated data to fill gaps.
Here’s an example:
Sources
Peng, T., Brucks, M., Gui, G., Merlau, D. J., Fan, G. J., et al. (2026, September 2). Digital twins are funhouse mirrors: Five systematic distortions. Science Advances, 12(36), eaeh8260. https://doi.org/10.1126/sciadv.aeh8260. (Twin response SD below humans' on 154 of 164 outcomes; full-twin accuracy 0.748 versus 0.746 for a demographics-only persona; average r = 0.20.)
Pourtaheri, K., & Zareei, A. (2026). Behavioral history outperforms descriptions of the person for LLM synthetic personas. arXiv:2610.03998. https://arxiv.org/abs/2610.03998
Toubia, O., Gui, G. Z., Peng, T., Merlau, D. J., Li, A., & Chen, H. (2025). Database report: Twin-2K-500. Marketing Science, 44(6), 1446–1455. https://doi.org/10.1287/mksc.2025.0262. ("The average test-retest accuracy across the 17 tasks is 81.72%.")