Adapted from a keynote at Data & Analytics Congres 2026, Utrecht, November 5, 2026. Theme of the day: Signal vs Noise.
By Adam Bai, Chief Strategy & Chief Innovation Officer, Panoplai. About 14 minutes.
A simple standard, seven tests, and a 12-week plan that works whatever platform you use.
1. The dead salmon
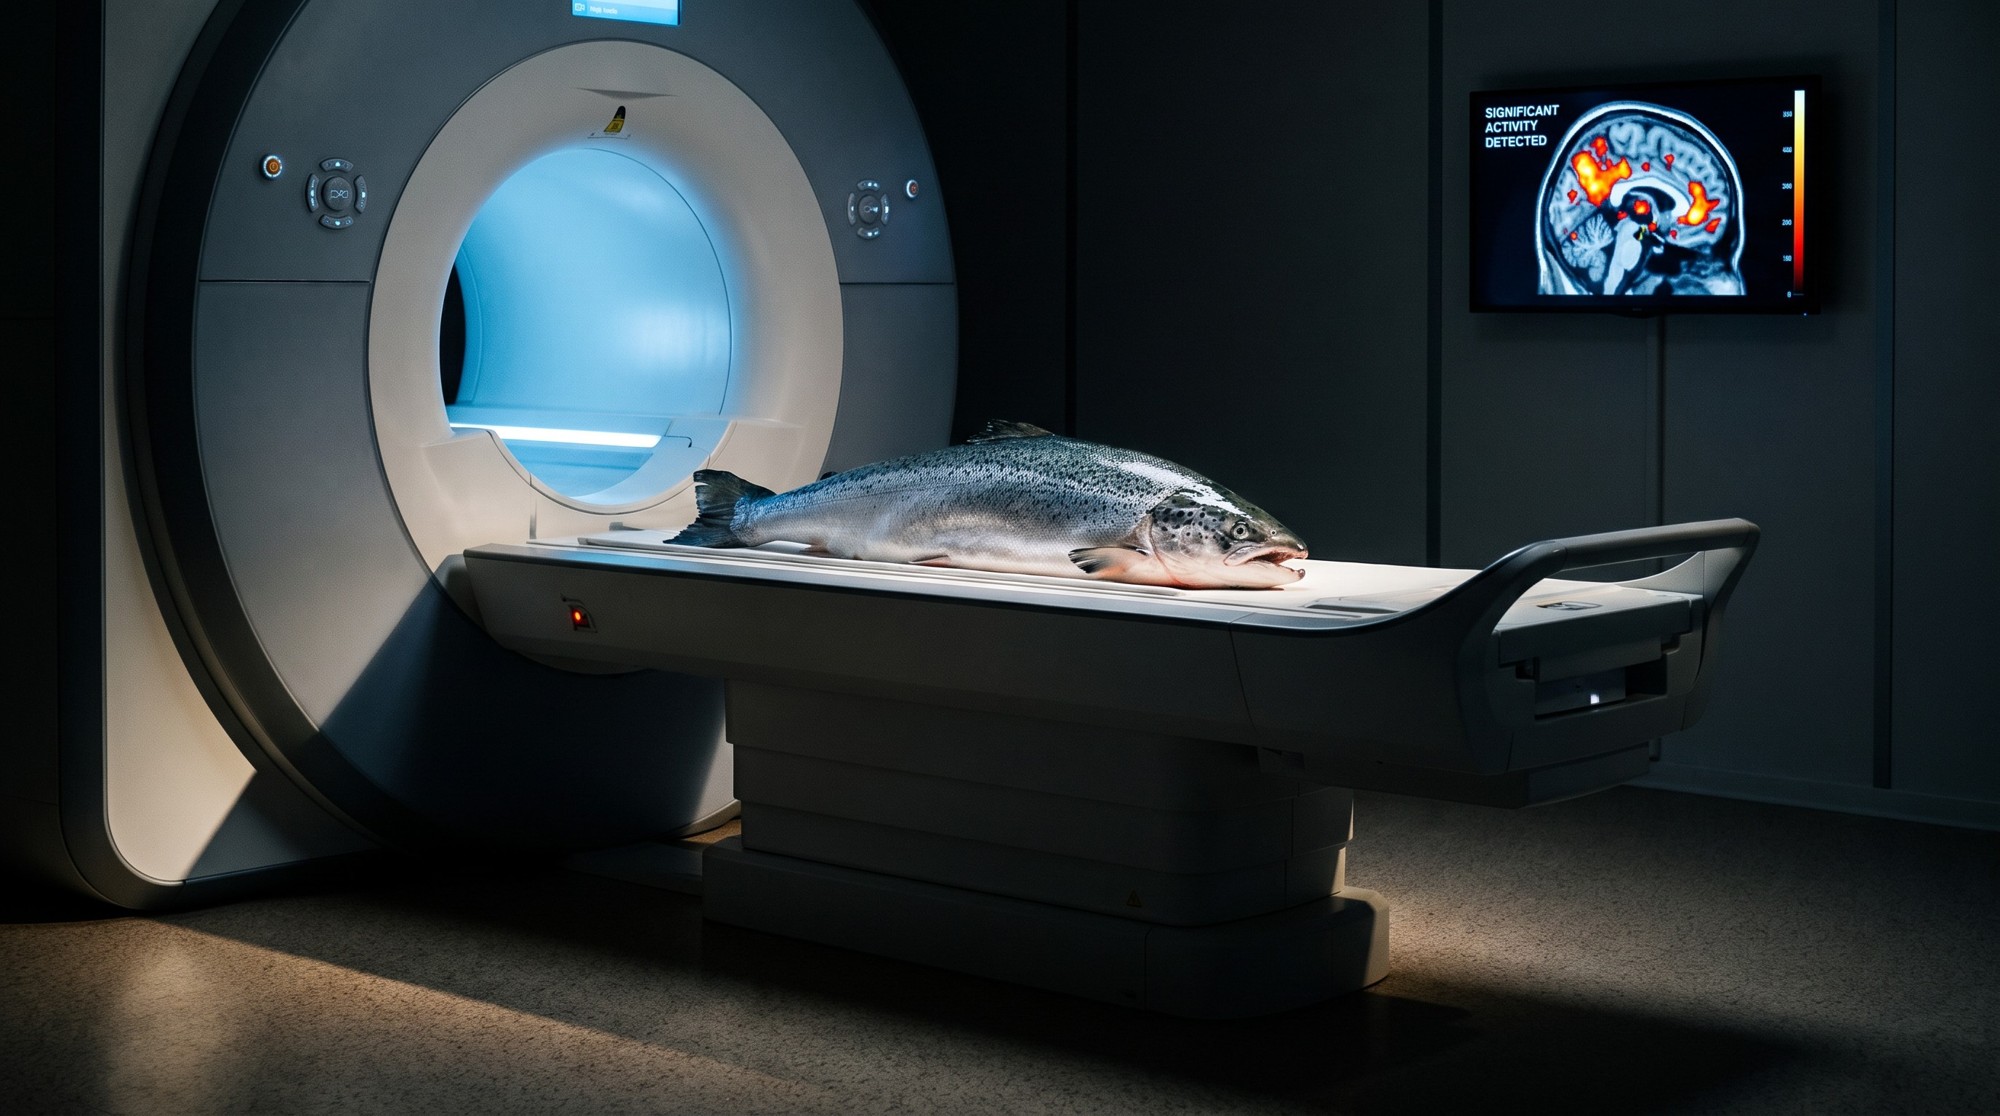
In 2009, some neuroscientists put a dead Atlantic salmon in an fMRI scanner, showed it photographs of people in social situations, and asked it what emotion each person was feeling. Then they ran the standard analysis.
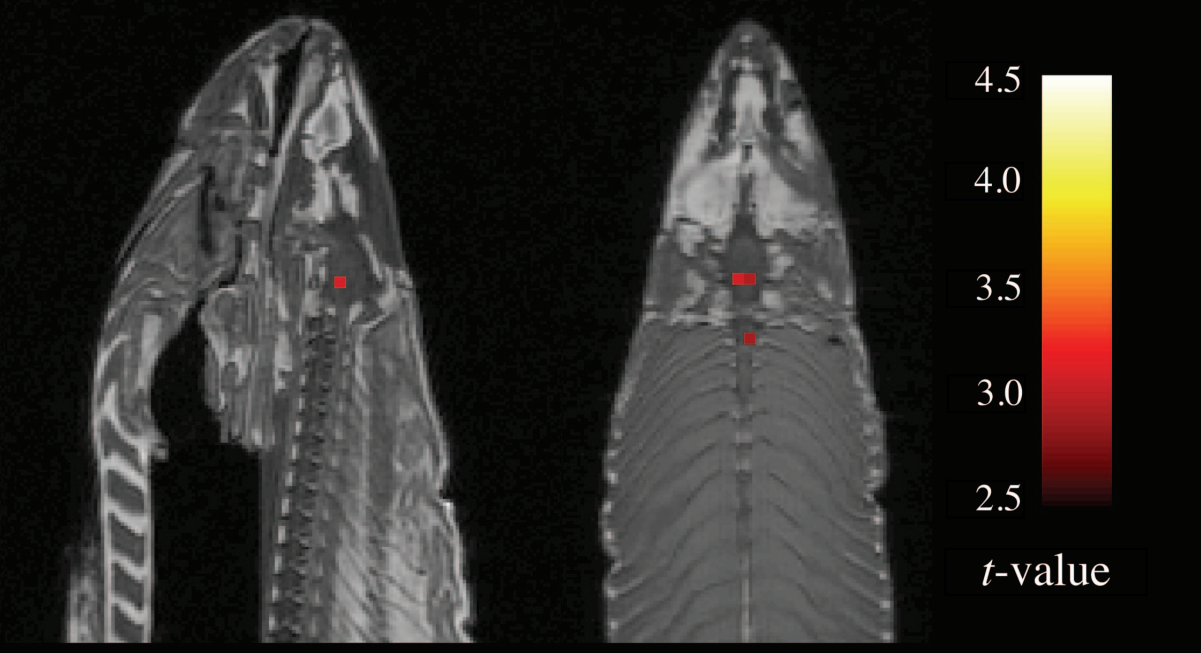
A small cluster of voxels (the 3D pixels of a brain scan) lit up. The dead salmon, statistically speaking, was responding to the humans in the photographs. [1]
The salmon’s “activity”. Bennett, Baird, Miller & Wolford (2010), Fig. 1. The study won the 2012 Ig Nobel Prize in Neuroscience.
This post isn’t really about miraculous seafood, however.
The point of the salmon was never the fish. Run enough comparisons without correcting for how many you ran, and the noise will suggest a plausible story. The authors published the salmon article to help their field develop more sophisticated and consistent practices to distinguish signal from noise. Seven years later another team ran the most common correction in the standard fMRI software on data where the right answer was already known to be nothing. It produced false positives at rates of up to 70%. [2]
The dead salmon is both a metaphor and a method. Run the version where the answer should be nothing, and see what your method generates.
2. The fish moves into the model
Three places a confident narrative comes from nothing
I keep thinking about that salmon because many marketing and innovation teams have already quietly handed a lot of their interpretation to AI. The model reads the tracker, summarizes the open ends, drafts the segment narrative, plays the consumer, and writes the slide that says “what the data tells us.” This feedback loop is often useful. Some of the time it is just a dead salmon in an fMRI scanner. The outputs are fluent, specific, and plausible whether or not there is signal underneath, and from the outside the two look identical.
Late last year a group of AI researchers published a paper with the title I wish I had thought of: “The Dead Salmons of AI Interpretability.” [3] They ran the tools used to explain what is going on inside neural networks on networks whose weights had been randomized. In other words, networks that had learned nothing. The tools produced plausible explanations anyway. Their diagnosis is the salmon’s: a method that confidently explains a system with no knowledge in it cannot be trusted when applied to one that has some.
These failures are not errors in the ordinary sense. Nobody gets a number wrong. Nobody ran the version where the answer should have been nothing.
Marketers and innovators are unusually exposed, because in our world the insight is the product. Nobody sends model weights or training data to the board. They send the story, and AI is very good at generating plausible stories about data.
Three spots the dead salmon has turned up recently:
Reading your own data: 1 in 3. Hypotheses reached an incorrect conclusion when a large language model did the labeling, with the best models. About half with smaller ones. Baumann et al. (2025). 37 annotation tasks, 13 million labels from 18 LLMs, 2,361 hypotheses.
Synthetic consumers: 154 of 164. Outcomes on which digital twins showed less spread than the humans they were built from. Nineteen pre-registered experiments, 23 researchers. Peng et al. (2026), Science Advances.
The people reading the output: 72%. Of marketers say their business has made a significant decision based on AI insight that later proved wrong or misleading. Only 37% verify AI insight most of the time. GWI (2026), 457 marketing professionals in the UK, US and Singapore.
Reading your own data
A 2025 study called “Large Language Model Hacking” asked whether the small choices made when an LLM labels text (which model, which prompt, how to handle the edge cases) change the conclusions a study reaches. Across 2,361 realistic hypotheses, the authors found incorrect conclusions in roughly a third of them with the best models, and about half with smaller ones. [4] The data was real, the analysis ran, and nothing in the output said the story was wrong a third of the time.
Who has let a model without any additional guardrails code their open-ended responses, Amazon reviews, or social comments this quarter?
Synthetic consumers
In September, Pew Research Center had an AI model adopt the personas of real members of its American Trends Panel and answer nearly 300 survey questions as virtual versions of them. Attitudes that are reasonably common in a group came back as nearly universal. Posing as “Hispanic adults”, the model said 97% were at least somewhat likely to follow the World Cup. The actual share was 43%. [5]
Common became near-universal. Share of Hispanic adults “at least somewhat likely” to follow the World Cup: what the model said, answering as panel members: 97%. What the actual survey found: 43%. The mean leaned the right way. The spread collapsed. (Pew Research Center Data Labs, September 30, 2026. [5])
The same month, 23 researchers led from Columbia University published “Digital twins are funhouse mirrors” in Science Advances: nineteen pre-registered experiments, 164 outcomes, and twins that correlated about 0.20 with the people they were built from, with less spread than the humans on 154 of the 164 measures. [6] A separate benchmark found that simulated respondents would send a team to the wrong segment in half of U.S. cases and most cross-cultural ones. [7]
Every one of these outputs would have made a great slide in an insights presentation.
The people reading the output
Researchers at Microsoft and Carnegie Mellon surveyed 319 knowledge workers and found that the more confident people were in using generative AI, the less critical thinking they reported doing with it. [8] GWI surveyed about 450 marketers in the UK, US and Singapore this summer. Nearly three quarters said their business had made a significant decision based on AI insight that later proved wrong or misleading, and only 37% said they verify AI insight most of the time. [9]
Who verifies AI insights most of the time?
Whose problem is this?
Nobody else in your building is going to run the salmon test.
Procurement cannot tell a grounded twin from a scraped one. IT will optimize for integration, not representativeness. Marketing wants an answer by Thursday. The CFO sees a license fee, not a validity threshold.
The people professionally trained to ask “is this true, and true of whom?” are the trained insights, research and analytics professionals, whichever team they’re part of or embedded in. If they do not own the dead salmon test, nobody owns it, and the fish tale does its work in the organization.
3. The critics are right
Understand what they tested before you apply the conclusions
A model prompted to “be a lapsed lawn-care buyer” with nothing underneath it is a dead salmon with a demographic label. It will answer every question, and it will sound like the internet’s idea of that person, because that is what it is.
The statistician who helps us with validation walked our team through the (very good!) Columbia paper the week it came out, and his advice was to take a closer look at what it tested: one recipe (an off-the-shelf model, prompted with a generic blueprint of personality and demographic scales, one pass per question), scored on how well each twin predicted its own human’s individual answers.
First, the correlation of 0.20 they achieved sounds awful. But a conventional machine-learning model trained on up to 650 real respondents with the same inputs never got above 0.29 on the same outcomes. [6] The ceiling was in the data, not the model. A Big Five personality score says very little about whether someone wants a digital passport for a luxury handbag.
Second, marketing does not operate at the individual level. Nobody launches a campaign to one respondent. You can be more accurate about each person and worse about the distribution of people, and it is the distribution that decides a price, a positioning, or a go/no-go. Statisticians have treated missing data as a probabilistic problem since Donald Rubin’s work on multiple imputation in the 1970s and 1980s: estimate it many times, average, and keep track of how uncertain you are. [10] A single confident answer is a single imputation with the error bars removed.
So look at what was tested before you try to understand the implications for your own work. Pew’s bottom line was that AI models are “not an adequate replacement for traditional polling on topics of broad public importance.” [5] That is right, and it describes one experiment. (Training data that is actually relevant to the topic matters enormously.) Twins built from a company’s own respondents, calibrated against a human sample, and asked aggregate questions about that company’s category are a different experiment.
4. Decision-grade or dead salmon?
How to tell a finding from a fish
Six contrasts. Any one of the items in the left-hand column can be produced by a model that knows nothing about your customers.
Dead salmon: A mean. Decision-grade: A distribution.
Dead salmon: The category average, in your segment’s name. Decision-grade: Distinctive to your organization.
Dead salmon: Says roughly the same thing about every concept. Decision-grade: Moves when the stimulus moves, the way humans move.
Dead salmon: A “because” with no source. Decision-grade: A citation you can open.
Dead salmon: “91% alignment,” no denominator. Decision-grade: Scored against how often humans agree with themselves.
Dead salmon: Only the hits. Decision-grade: The misses, printed next to the hits.
One small example from client work with Mars: why people really chew gum
What real consumers told us: “I chew gum before a big work project. It’s not about the flavor. It helps me focus.”
Some segments of consumers chew gum not only for flavor or social currency, but because it helps them concentrate, before the moments at work that ask for it. A real, specific behavioral insight, and one that fieldwork found.
What an ungrounded AI persona tends to say: “People choose gum mainly for fresh breath, especially in social settings.”
Confident. Fluent. Plausible. And incomplete in exactly the way that matters: it reproduces the internet’s average answer, not the full range of this segment’s actual behavior.
Fluency is not fidelity.
The standard: decision fidelity
The dead salmon is best seen as a test that can be applied to future datasets and methodologies. The question is not “how accurate is it?” but “would we make the same, or better, decisions with digital twins, synthetic data or simulations as part of our innovation or marketing process?” Call that standard decision fidelity. Whatever the tool or vendor, it comes down to the right-hand column of the table above: is the output accurate on the distribution and not just the mean, is it distinctive to your organization rather than the category average (if a persona built on nothing but demographics answers as well as the twin built on your data, you have learned about the internet and not your consumers), and does it differentiate between segments and stimuli in ways that would change a decision?
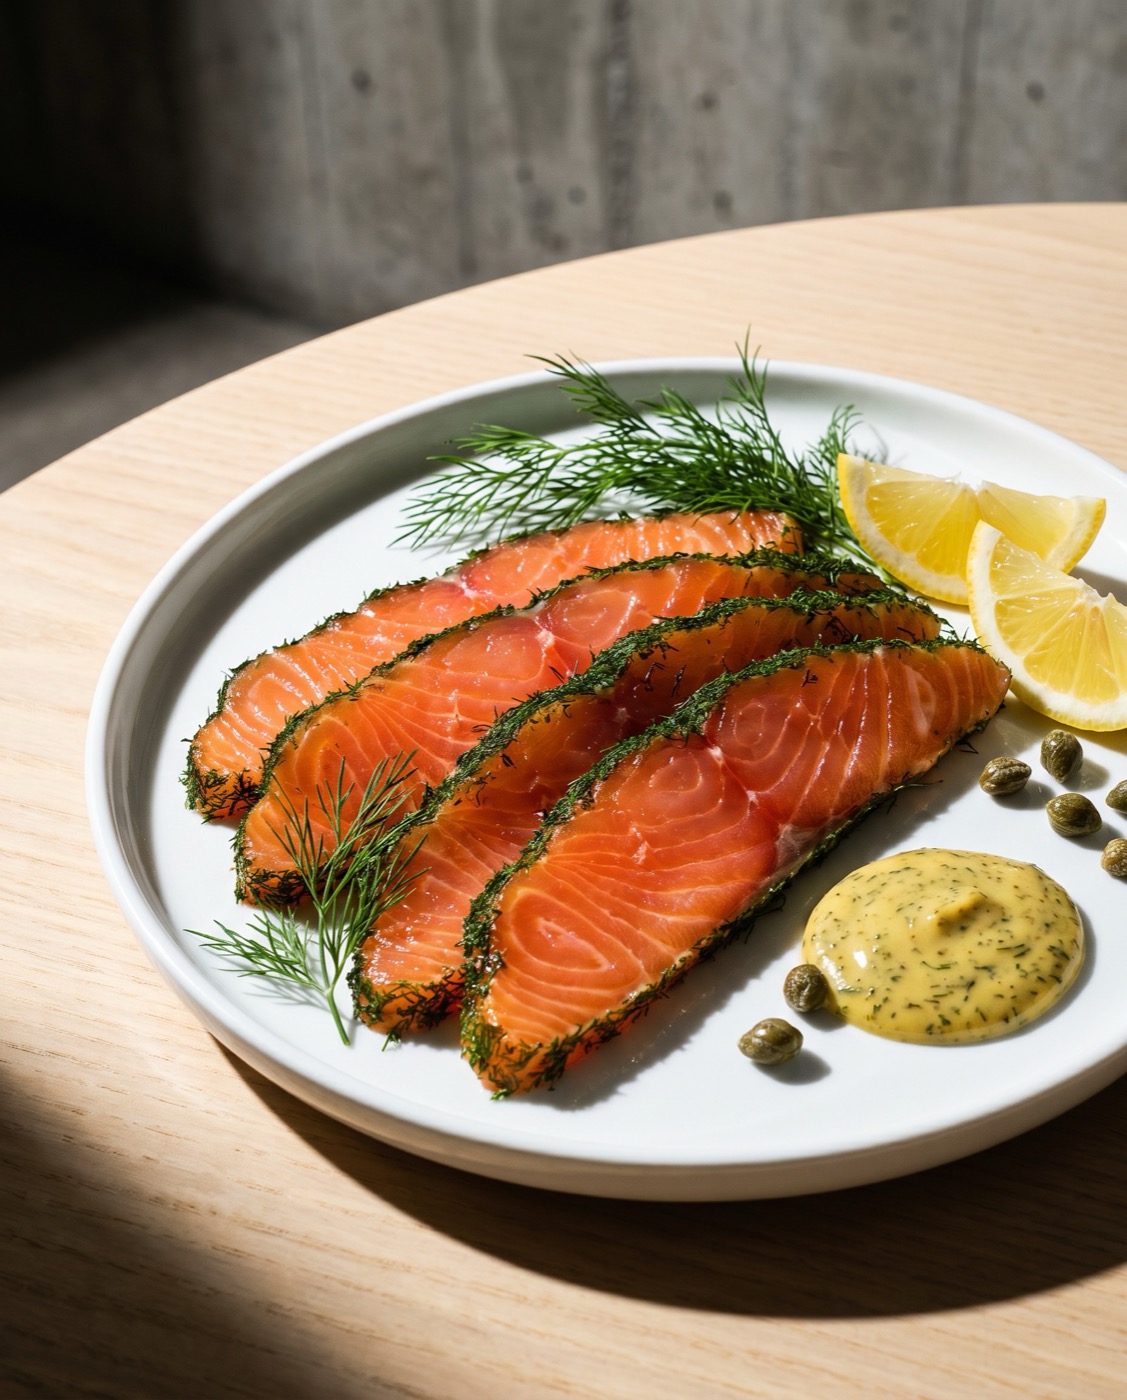
Or are we just looking at a plate of gravlax?
Notes
Not all of these tests are automated in the Panoplai platform. Some are conducted manually as part of our own research-on-research program or in the context of client work.
There’s still lots of confusion in the market about what we’re validating against. That is, are we trying to replicate survey or interview data in response to the same stimuli? Or are we trying to predict purchases, clicks, or churn? Insights professionals have been wrestling with the “say-do gap” for decades and, as we all know, surveys don’t have an amazing track record of predicting behavior. That’s why drawing on both behavioral (the “what”) and opinion (the “why”) data to construct digital twins is the best path forward.
5. What good looks like
The Dead Salmon Test, in seven parts
Seven tests to help. None of them needs a vendor, most of them take an afternoon, and they apply whatever tool, technology or platform is involved. Of course there are many other categories of tests that make sense too! These are simply a place to start!
1. The null. Ask a model that knows nothing about your customers the same questions. If the generic persona’s answer is as good as the one built on your data, you have learned about the internet. Columbia ran this baseline, and a persona given only demographics matched the full twin on accuracy (0.746 versus 0.748). [6] Any vendor can run it in an afternoon. Ask.
2. The holdout. Keep back human answers the model never saw and grade the output question by question, the way the fMRI field finally tested its pipeline on data where the answer was known. A single headline accuracy number is our industry’s uncorrected multiple comparison. The per-question grades, misses included, are the correction.
3. The ceiling. Ask the same humans the same questions twice. In Columbia’s Twin-2K-500 panel, people agreed with themselves only about four times in five when re-asked. [11] No model should beat that, and “91% alignment” without that denominator is decoration.
4. The distribution, not the mean. Pew’s World Cup result was a variance failure, and a headline average would have hidden it. A mean is a story. A distribution is evidence. Ask to see both.
5. The intervention. Change the stimulus (a concept, a price, an ad) and check whether the reaction moves the way human reactions move. A twin that says roughly the same thing about every concept is reciting, not responding.
6. The citation. A “because” is a narrative unless it is tied to a source you can open. Researchers have shown more than once that models’ accounts of their own reasoning often do not match what they actually did. [12] People are no better; in 1977 Nisbett and Wilson showed that we confidently report reasons for our choices that were not the causes. [13] As somebody who was trained as an anthropologist, this is hardly surprising. Remember that a cited answer beats an eloquent one, from a digital twin (or from a colleague!).
7. The published misses. Ask the vendor, or your own team, for the questions the model got wrong. If there are none, you are looking at a dead salmon.
6. When the tests run themselves
Validation isn’t a single score. It’s a process.
Here is the practical problem with that list. Run by hand, it is a research-on-research project. Most teams will do it once, on the pilot, and never again. The dead salmon authors’ real contribution was not catching one fish. It was getting the correction built into the standard research pipeline, so that nobody had to remember to run it.
That is the approach we have taken at Panoplai, and I’ll describe it because I think it is the right approach for validation, whoever builds the twins or synthetic datasets. (We’re not the only platform with automated validation of course; but we’re especially proud of our comprehensive approach.)
Start with what a twin is built from, because that determines most of the rest. A twin should not be a persona written from demographics. Ours are audiences cut from a client’s own respondents (surveys, open ends, interview transcripts, trackers, CRM, reviews, and increasingly behavioral data), calibrated against a large pool of real human question-and-answer pairs across categories and countries. Reliable synthetic data starts with rich source data, rigorous calibration, and transparent validation.
Our Trust & Validation page describes the same pipeline in four parts (ground truth, data depth, modeling, and contextual accuracy through parallel testing). The five steps here are that framework seen from inside the product.
Ingest & clean. Your data. Cleaned, secured, walled: survey, behavioral, CRM, qualitative, structured or unstructured raw files.
Calibrate. Reality check against patterns observed across a large pool of real human question-and-answer pairs.
Triangulate & generate. What people do, what they say, why they do it, what they express.
Audit & score. Logic and consistency, persona fidelity, data grounding, confidence, validation metrics.
Classify. Every question labeled lead, support or explore before anyone reads the answer.
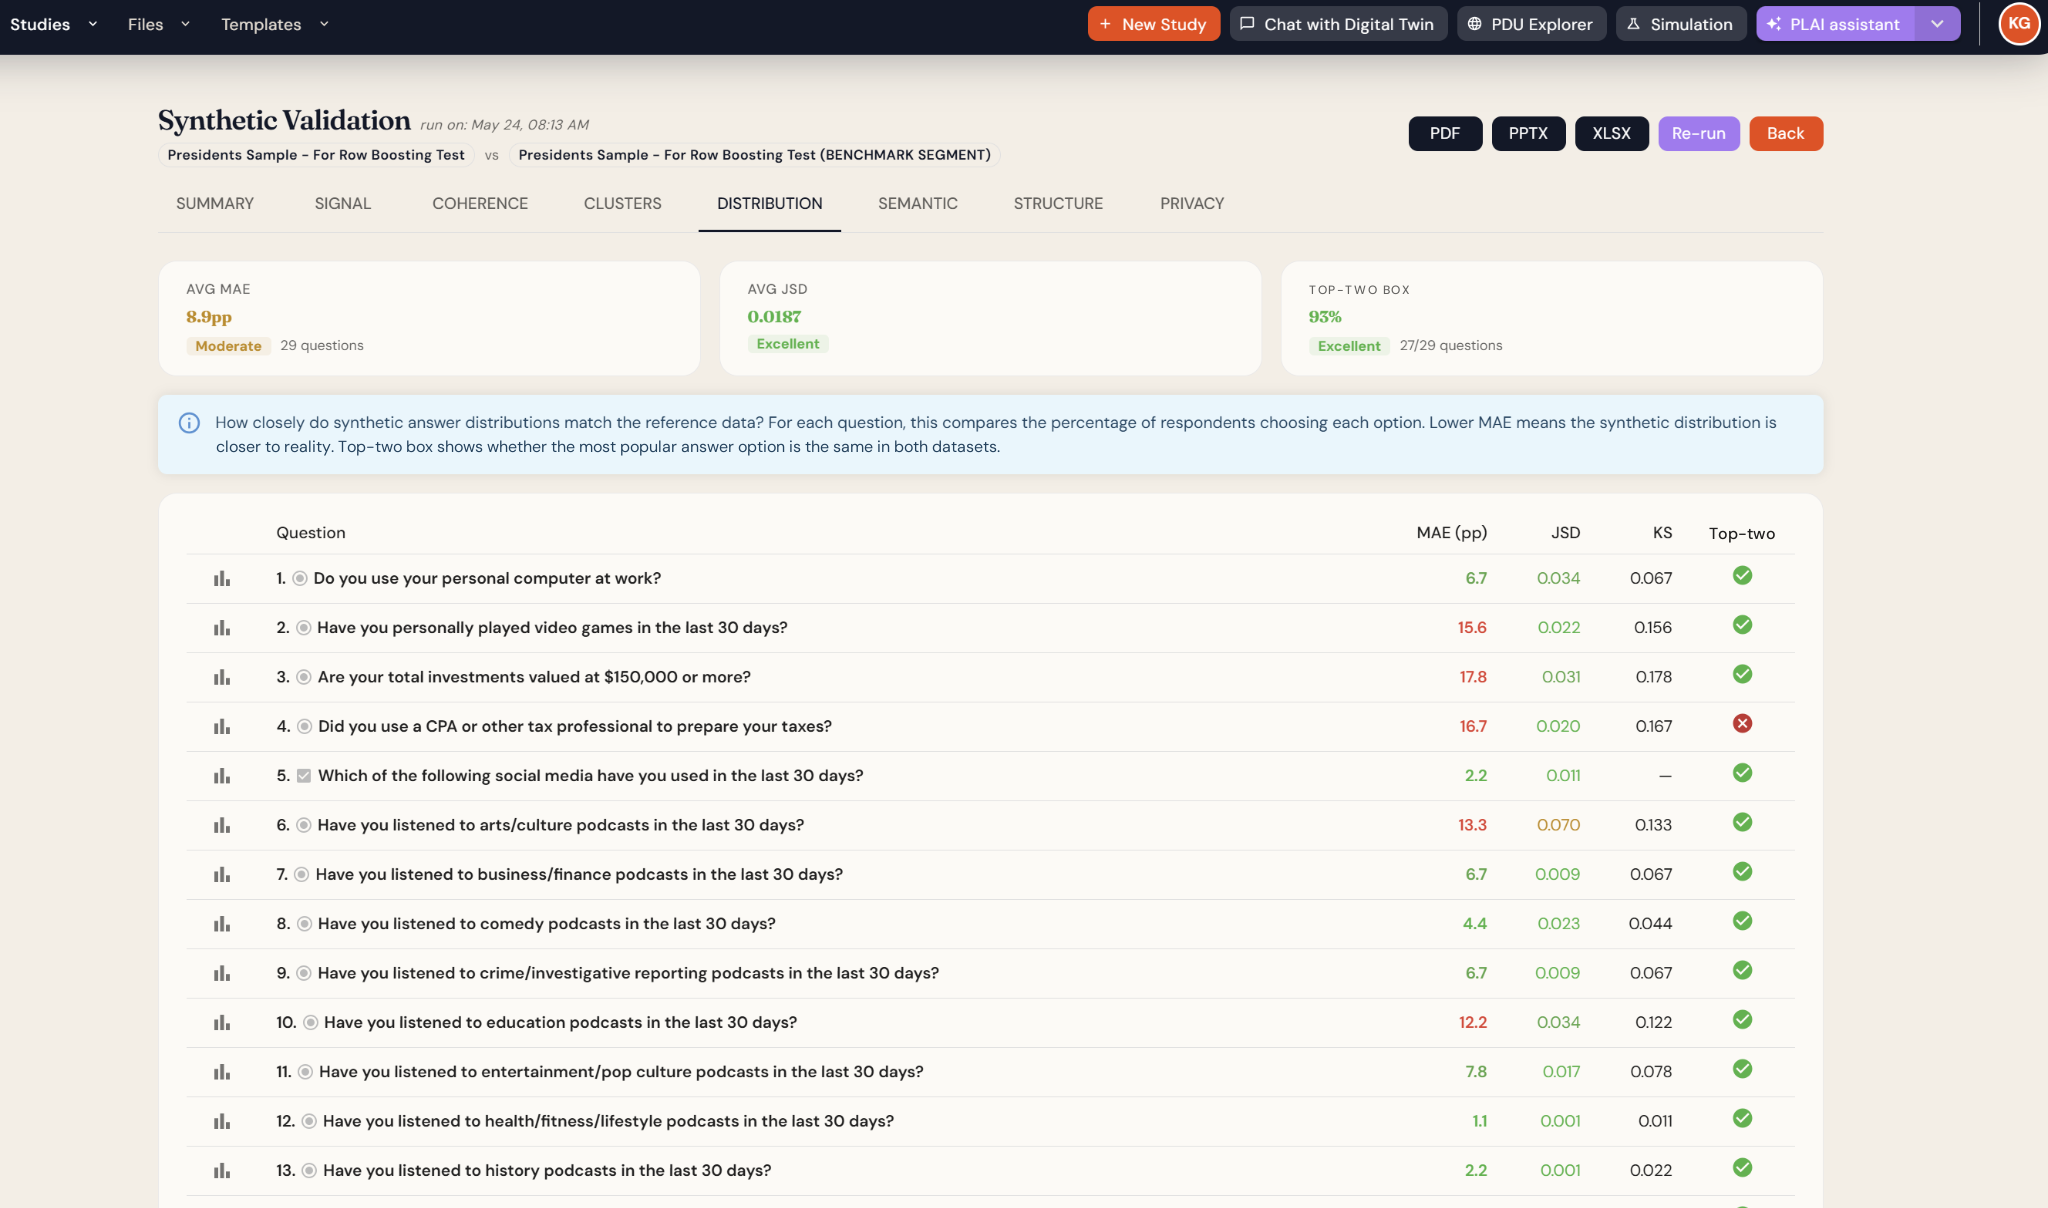
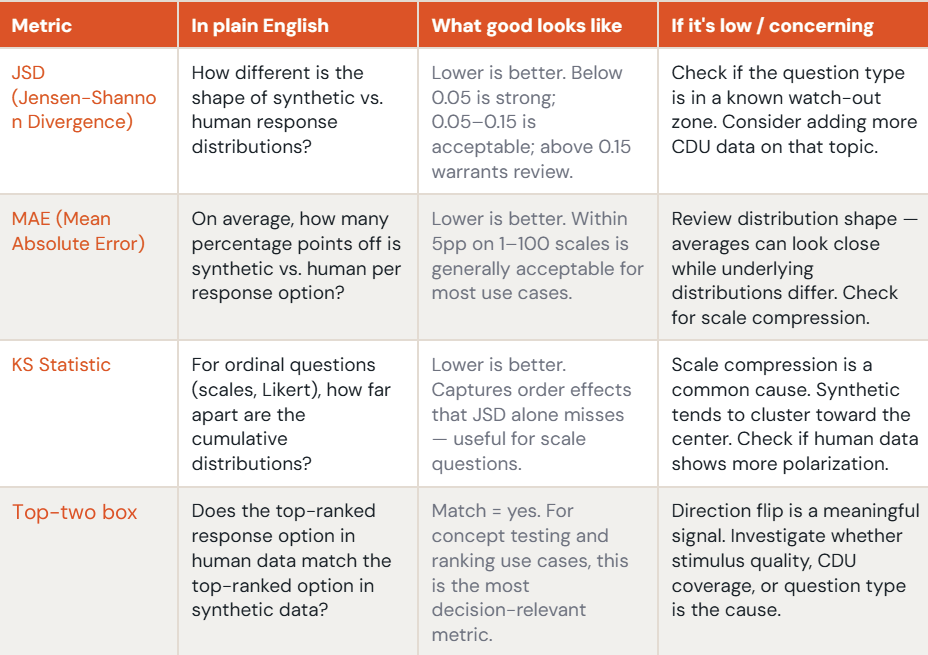
The validation runs on every study. The pipeline ingests and cleans the client’s data, calibrates it, generates the synthetic answers, then scores them against human data the twins never saw: a held-out slice of the client’s respondents, or a newly fielded wave. The scores compare full distributions rather than means alone (mean absolute error per answer option; Jensen-Shannon divergence per question, which measures how far apart two distributions sit; the correlation structure between questions; and winner match on ranked items). Each question then gets its label: lead (high confidence, decision ready), support (use alongside other inputs), or explore (a hypothesis for early work). That is the holdout (test 2) and the distribution (test 4) as a readout a brand team actually sees, with the misses printed next to the hits.
Tests 2 and 4 as a readout. Every question scored against held-out human data, with the misses printed next to the hits (question 4 here). Panoplai platform, demo workspace.
What the scores mean, in plain English, and what to do when one is low.
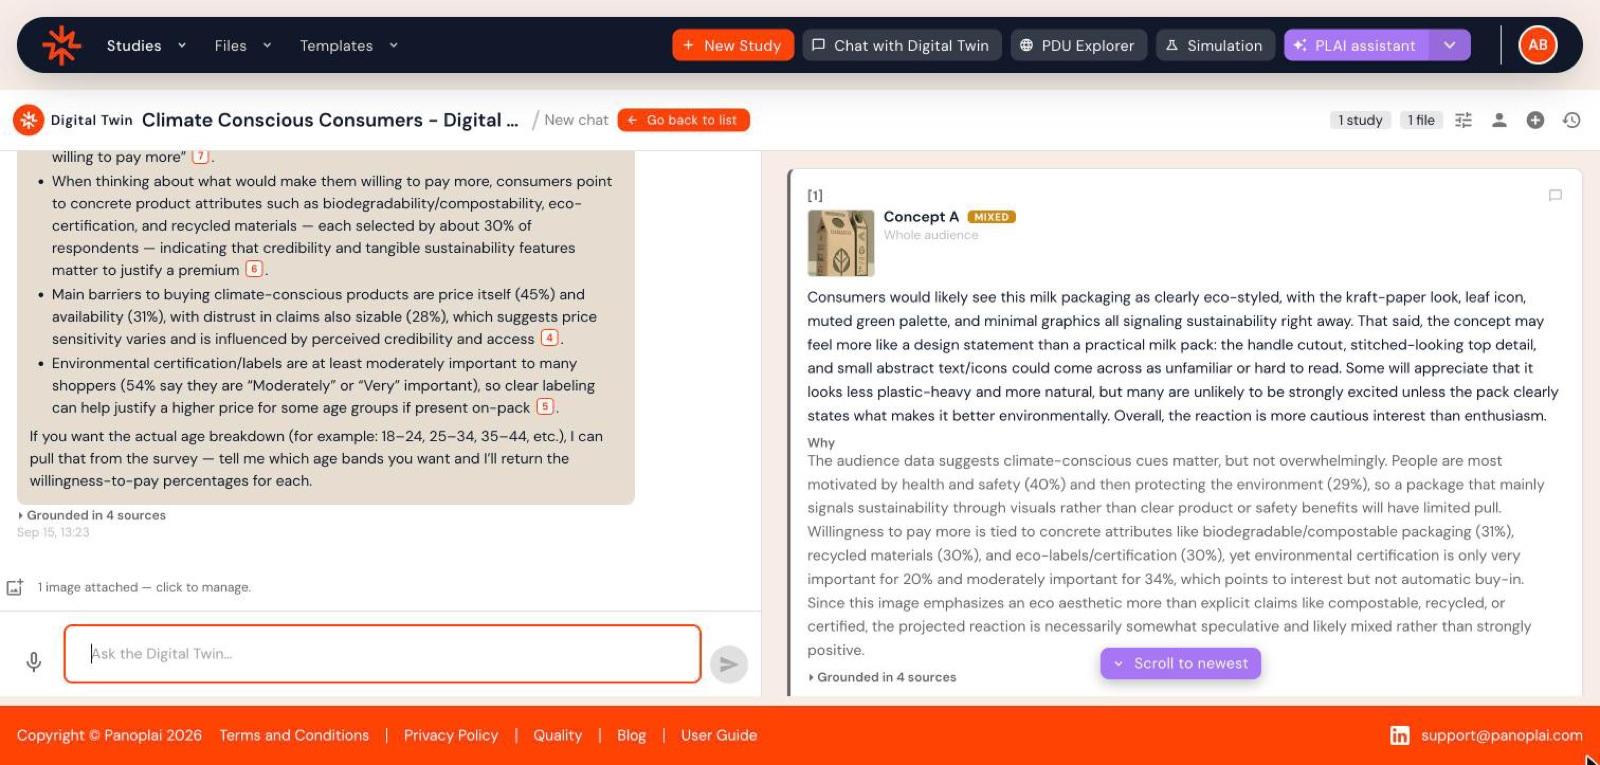
Test 6, the citation, is built in rather than bolted on after the fact. Every answer cites the study, file, or transcript it drew on, so the “because” is a source you can open.
A twin built from a client’s own respondents, about a concept test. Each claim links to the survey, open end or transcript behind it. Panoplai platform, demo workspace.
The intervention (test 5) is a workflow rather than a report. Run the concept, price, or ad on the twins, then launch the human study from the same screen: real people through panel partners in 100+ countries, AI-moderated interviews, or a recontact of the original respondents. The human result is scored against the synthetic one and feeds the next version of the twin, so the twin gets more accurate with each dataset instead of drifting.
Test 7, in public: the Mars report card
With Mars we did this in public. We graded twins question by question against real consumers and presented the misses alongside the hits at ESOMAR Congress this September, where the paper was a finalist for the best paper award. [14] Accuracy is 1 minus mean absolute error against first-party data. Four dimensions in, four dimensions out.
Behavioral realism: 91 to 97% descriptive accuracy against human panel data across the parallel tests, with 91% as the headline figure (stated behavior). Lowest single question 84.8%. One of 23 survey questions fell below 85%. Accuracy tracked question type more than question format.
Qualitative depth: A− / B+ against researcher judgment. Fluent and easy to read. Sub-graded: themes A, type of themes B, prioritization C. Sometimes repetitive or overly polished versus real segment language.
Edge cases: Surfaced edge cases and emerging themes the survey did not reach. The twins raised them; the human focus groups and interviews are what validated them. Surfacing is not confirmation, and we did not treat it as one.
Benchmark alignment: Above the client’s 80% threshold on every measure. Spearman’s rho at or above 0.90. We fixed the threshold before the results existed. Rank-order agreement is not the same claim as absolute accuracy.
A rubric that always scores green is marketing, not validation.
The validation paid for itself, which is the part skeptical finance teams tend to ask about first. Using the twins for iterative concept refinement before committing to human fieldwork cut the overall research program cost by more than 30% and shortened time-to-validation by about 25%, against a conventional qual-then-quant workflow. [14] That is enough to fund a proper validation program and still come out ahead.
7. Cases
Where the output was specific to one brand
Not “we used AI”. Each of these produced something only that organization could have produced, because of what went in and who stayed in the loop. And in every one, the twin did not replace a researcher. It removed a bottleneck that was stopping researchers from being used properly.
Innovation validation: Mars. Targeted UK gum consumer segments. Could a twin be trusted for real innovation decisions? Firefish depth interviews, an existing Mars survey and a new 500-person survey, ingested into a walled garden and validated in parallel against 250 real consumers from the same segments shown the same stimuli. Result: 91% descriptive accuracy and Spearman’s rho at or above 0.90 on rank-order preference. 30%+ cost reduction, about 25% faster time-to-validation. [14] Misses published.
Marketing speed: Prudential. Two days to make a creative platform decision, not six weeks. Institutional-investor interviews and trackers ingested; the twins embedded inside the joint client and agency team rather than in a research silo. Result: digital twin interviews aligned with all 33 human investor interviews, in a small fraction of the fielding time. The team now moves roughly 45% faster.
Persona feedback: HubSpot. Who are our core buyers, really? 1,000+ decision-makers surveyed, then continuously enriched with 200+ surveys over three years. Result: 20%+ lift in views on content built with it. 25% research cost saving. Users across several global teams.
From islands to continents: Scotts Miracle-Gro. Data everywhere and no way to connect it. Hundreds of open ends, thousands of service calls and thousands of reviews ingested into one connected universe. Result: about 90% reduction in synthesis time. A customer-service team with no qual background onboarded in a single working session, now producing defensible qual.
8. A plan anyone can run
Whatever platform, vendor, industry or use case
What to ask any vendor, including us
Ask for a per-question validation on your own study, not on vendor data or generic category data. Concretely, that means the null run alongside (a model that knows nothing about your customers, same questions, side by side), the holdout (human answers the model never saw), the distribution scored and not just the mean, the human test-retest ceiling you are being scored against, and the misses, question by question. In other words, tests 1 to 4 and test 7 from the list above, run on your data rather than theirs.
Your 12-week plan
Twelve weeks from “cool demo” to a plan and a report card you would sign and then reuse. Each step has an owner and an artifact. Agree on the thresholds before you see the results. (Much of this work is automated in the Panoplai platform.)
Weeks 1–2: One decision, one audience. A decision with a date on it, and the person who signs off. Not a whole category, or a generic use case.
Weeks 3–4: Hold back the humans. Keep a slice of your own respondents the model never sees. Run the null alongside.
Weeks 5–8: Build, then grade. Score every question against the holdout. Label each one lead, support or explore.
Weeks 9–10: Change the stimulus. A concept, a price, an ad. Field a human check and compare the movement.
Weeks 11–12: Publish the report card. Misses next to hits. Thresholds that were fixed before the results existed.
Always work backwards from the intersection between an urgent business question and an audience. Deeper is better than broader as a way to get started.
A request
Next time AI hands you a clean narrative about your customers, ask what it would have said about a dead fish. Then run the null. Ask for the misses. Look at the spread, not the mean. If a vendor is involved (including us), ask for a per-question validation on your own study: the holdout, the distribution scores, and the questions that failed. If they can’t produce one, that tells you most of what you need to know. [14][15]
What matters in the end is decision fidelity.
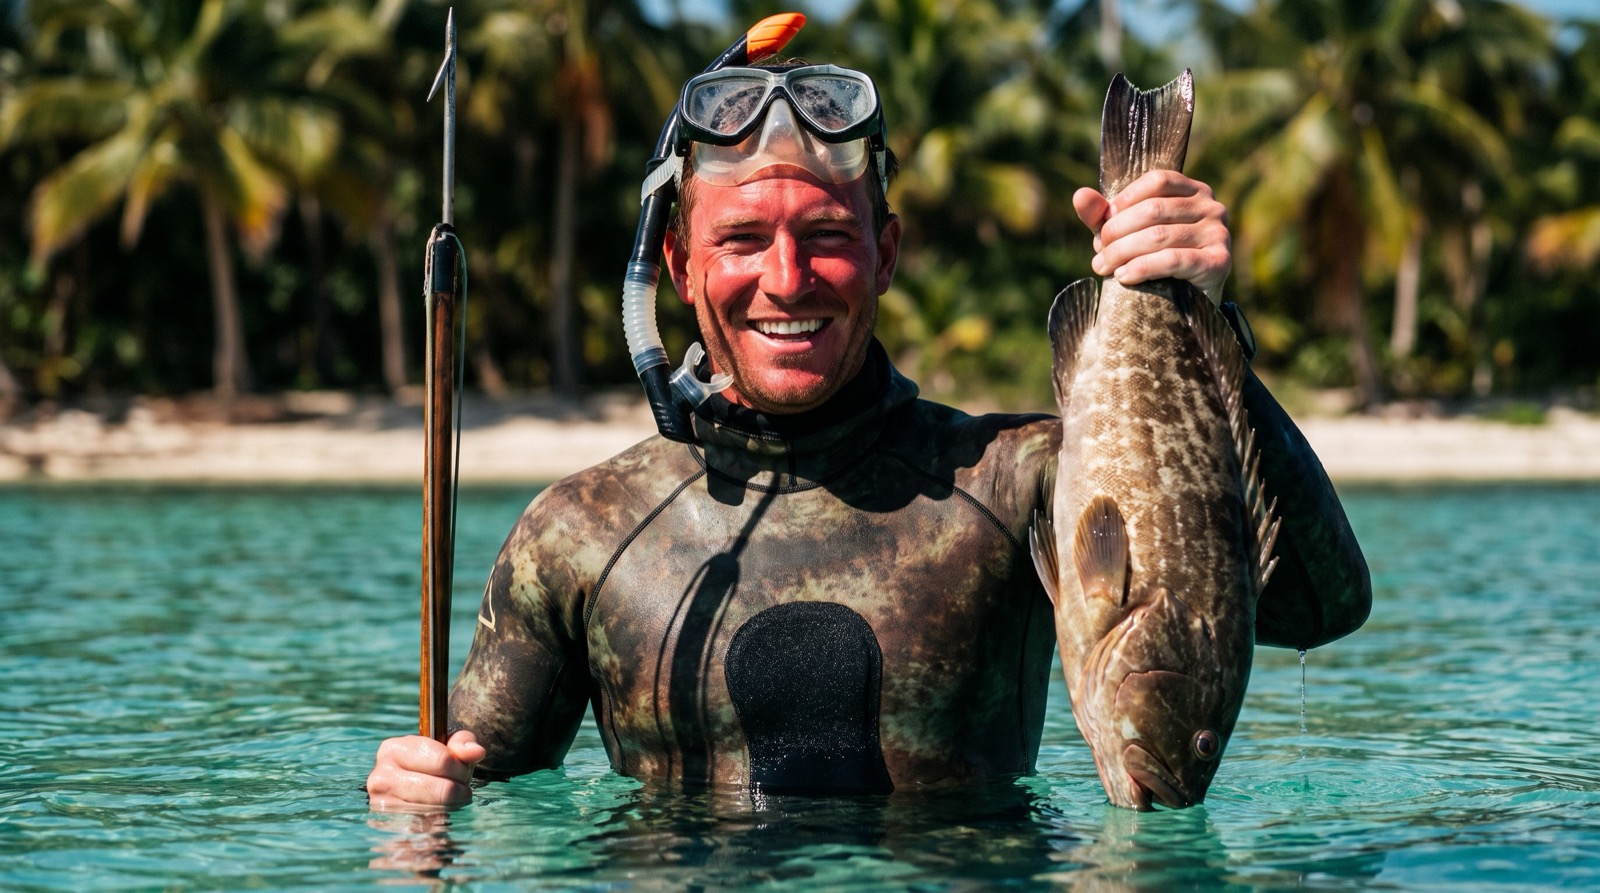
“I Am a Tinder Guy Holding a Fish and I Will Provide for You”
Would you trust this man with your business decisions? Headline from the piece of the same name by Amy Collier, The New Yorker (Daily Shouts), May 1, 2017. Photo: AI-generated illustration.
And if you have a dead salmon story of your own, a confident, fluent, completely wrong AI read that almost made it into a decision, I would love to hear about it. The original salmon authors published theirs, and their field got better for it.
Email me: adam@panoplai.com
Sources
Bennett, C. M., Baird, A. A., Miller, M. B., & Wolford, G. L. (2010). Neural correlates of interspecies perspective taking in the post-mortem Atlantic salmon: An argument for proper multiple comparisons correction. Journal of Serendipitous and Unexpected Results, 1(1), 1–5. PDF. First presented as a conference poster in 2009 (NeuroImage, 47, Suppl. 1, S125). Ig Nobel Prize in Neuroscience, 2012. Accessible summary: Scientific American, September 25, 2012.
Eklund, A., Nichols, T. E., & Knutsson, H. (2016). Cluster failure: Why fMRI inferences for spatial extent have inflated false-positive rates. PNAS, 113(28), 7900–7905. doi:10.1073/pnas.1602413113. Correction: PNAS 113(33), E4929. The “up to 70%” figure is the maximum familywise error rate for parametric cluster-extent inference in SPM, FSL and AFNI on null resting-state data, against a nominal 5%.
Méloux, M., Dirupo, G., Portet, F., & Peyrard, M. (2025). The dead salmons of AI interpretability. arXiv:2512.18792. arxiv.org/abs/2512.18792. Accepted as an oral at NeurIPS 2026 under the extended title “The Dead Salmons of AI Interpretability: The Need for a Statistical Inference Perspective.”
Baumann, J., Röttger, P., Urman, A., Wendsjö, A., Plaza-del-Arco, F. M., Gruber, J. B., & Hovy, D. (2025). Large language model hacking: Quantifying the hidden risks of using LLMs for text annotation. arXiv:2509.08825. arxiv.org/abs/2509.08825. (37 annotation tasks from 21 social-science studies; 13 million labels from 18 LLMs; 2,361 hypotheses.)
Chapekis, A., Lau, A., Bestvater, S., Shah, S., Mercer, A., & Smith, A. (2026, September 30). Can AI stand in for human survey takers? Not really. Pew Research Center, Data Labs. Report · Methodology.
Peng, T., Brucks, M., Gui, G., Merlau, D. J., Fan, G. J., Ben Sliman, M., Johnson, E. J., … & Toubia, O. (2026). Digital twins are funhouse mirrors: Five systematic distortions. Science Advances, 12(36), eaeh8260. doi:10.1126/sciadv.aeh8260. Preprint: arXiv:2509.19088. (Average r = 0.20 across 164 outcomes; full-twin accuracy 0.748 versus 0.746 for a demographics-only persona; twin response SD below humans’ on 154 of 164 outcomes; the full-persona XGBoost model trained on up to 650 respondents remains below 0.29.)
Chen, Z., Zhu, D., & Zheng, L. N. (2026). When synthetic users fail: A cross-domain benchmark of LLM-simulated human survey responses. arXiv:2607.26348, v2, October 4, 2026. arxiv.org/abs/2607.26348.
Lee, H.-P., Sarkar, A., Tankelevitch, L., Drosos, I., Rintel, S., Banks, R., & Wilson, N. (2025). The impact of generative AI on critical thinking: Self-reported reductions in cognitive effort and confidence effects from a survey of knowledge workers. CHI ’25. ACM. doi:10.1145/3706598.3713778. (319 knowledge workers; self-reported associations, not causal findings.)
GWI. (2026, September 30). Marketers say wrong AI insight has already cost their organization [press release]. gwi.com. Survey of 457 marketing professionals in the UK, US and Singapore, fielded July 2026. The 72% and 37% figures are the all-market base.
Rubin, D. B. (1987). Multiple Imputation for Nonresponse in Surveys. Wiley. doi:10.1002/9780470316696. See also Rubin, D. B. (1976). Inference and missing data. Biometrika, 63(3), 581–592.
Toubia, O., Gui, G. Z., Peng, T., Merlau, D. J., Li, A., & Chen, H. (2025). Database report: Twin-2K-500: A data set for building digital twins of over 2,000 people based on their answers to over 500 questions. Marketing Science, 44(6), 1446–1455. doi:10.1287/mksc.2025.0262. (“The average test-retest accuracy across the 17 tasks is 81.72%.”)
Turpin, M., Michael, J., Perez, E., & Bowman, S. R. (2023). Language models don’t always say what they think: Unfaithful explanations in chain-of-thought prompting. NeurIPS 2023. arxiv.org/abs/2305.04388. Also Chen, Y., et al. (2025). Reasoning models don’t always say what they think. Anthropic; arXiv:2505.05410.
Nisbett, R. E., & Wilson, T. D. (1977). Telling more than we can know: Verbal reports on mental processes. Psychological Review, 84(3), 231–259. doi:10.1037/0033-295X.84.3.231.
twenty44 / Panoplai (2026, January). The Future of Customer Understanding: A New Framework for Digital Twin & Synthetic Data Validation. Validation white paper, written independently by twenty44, sponsored by Panoplai. content.panoplai.com.